Phase 1: Capture Your Run
Steps 1-4: Set up the band, record clean footage, and upload for analysis.
Follow these four steps to get a usable reading. The quality of the hip drop result depends heavily on clean camera position, visible landmarks, and a consistent treadmill effort.
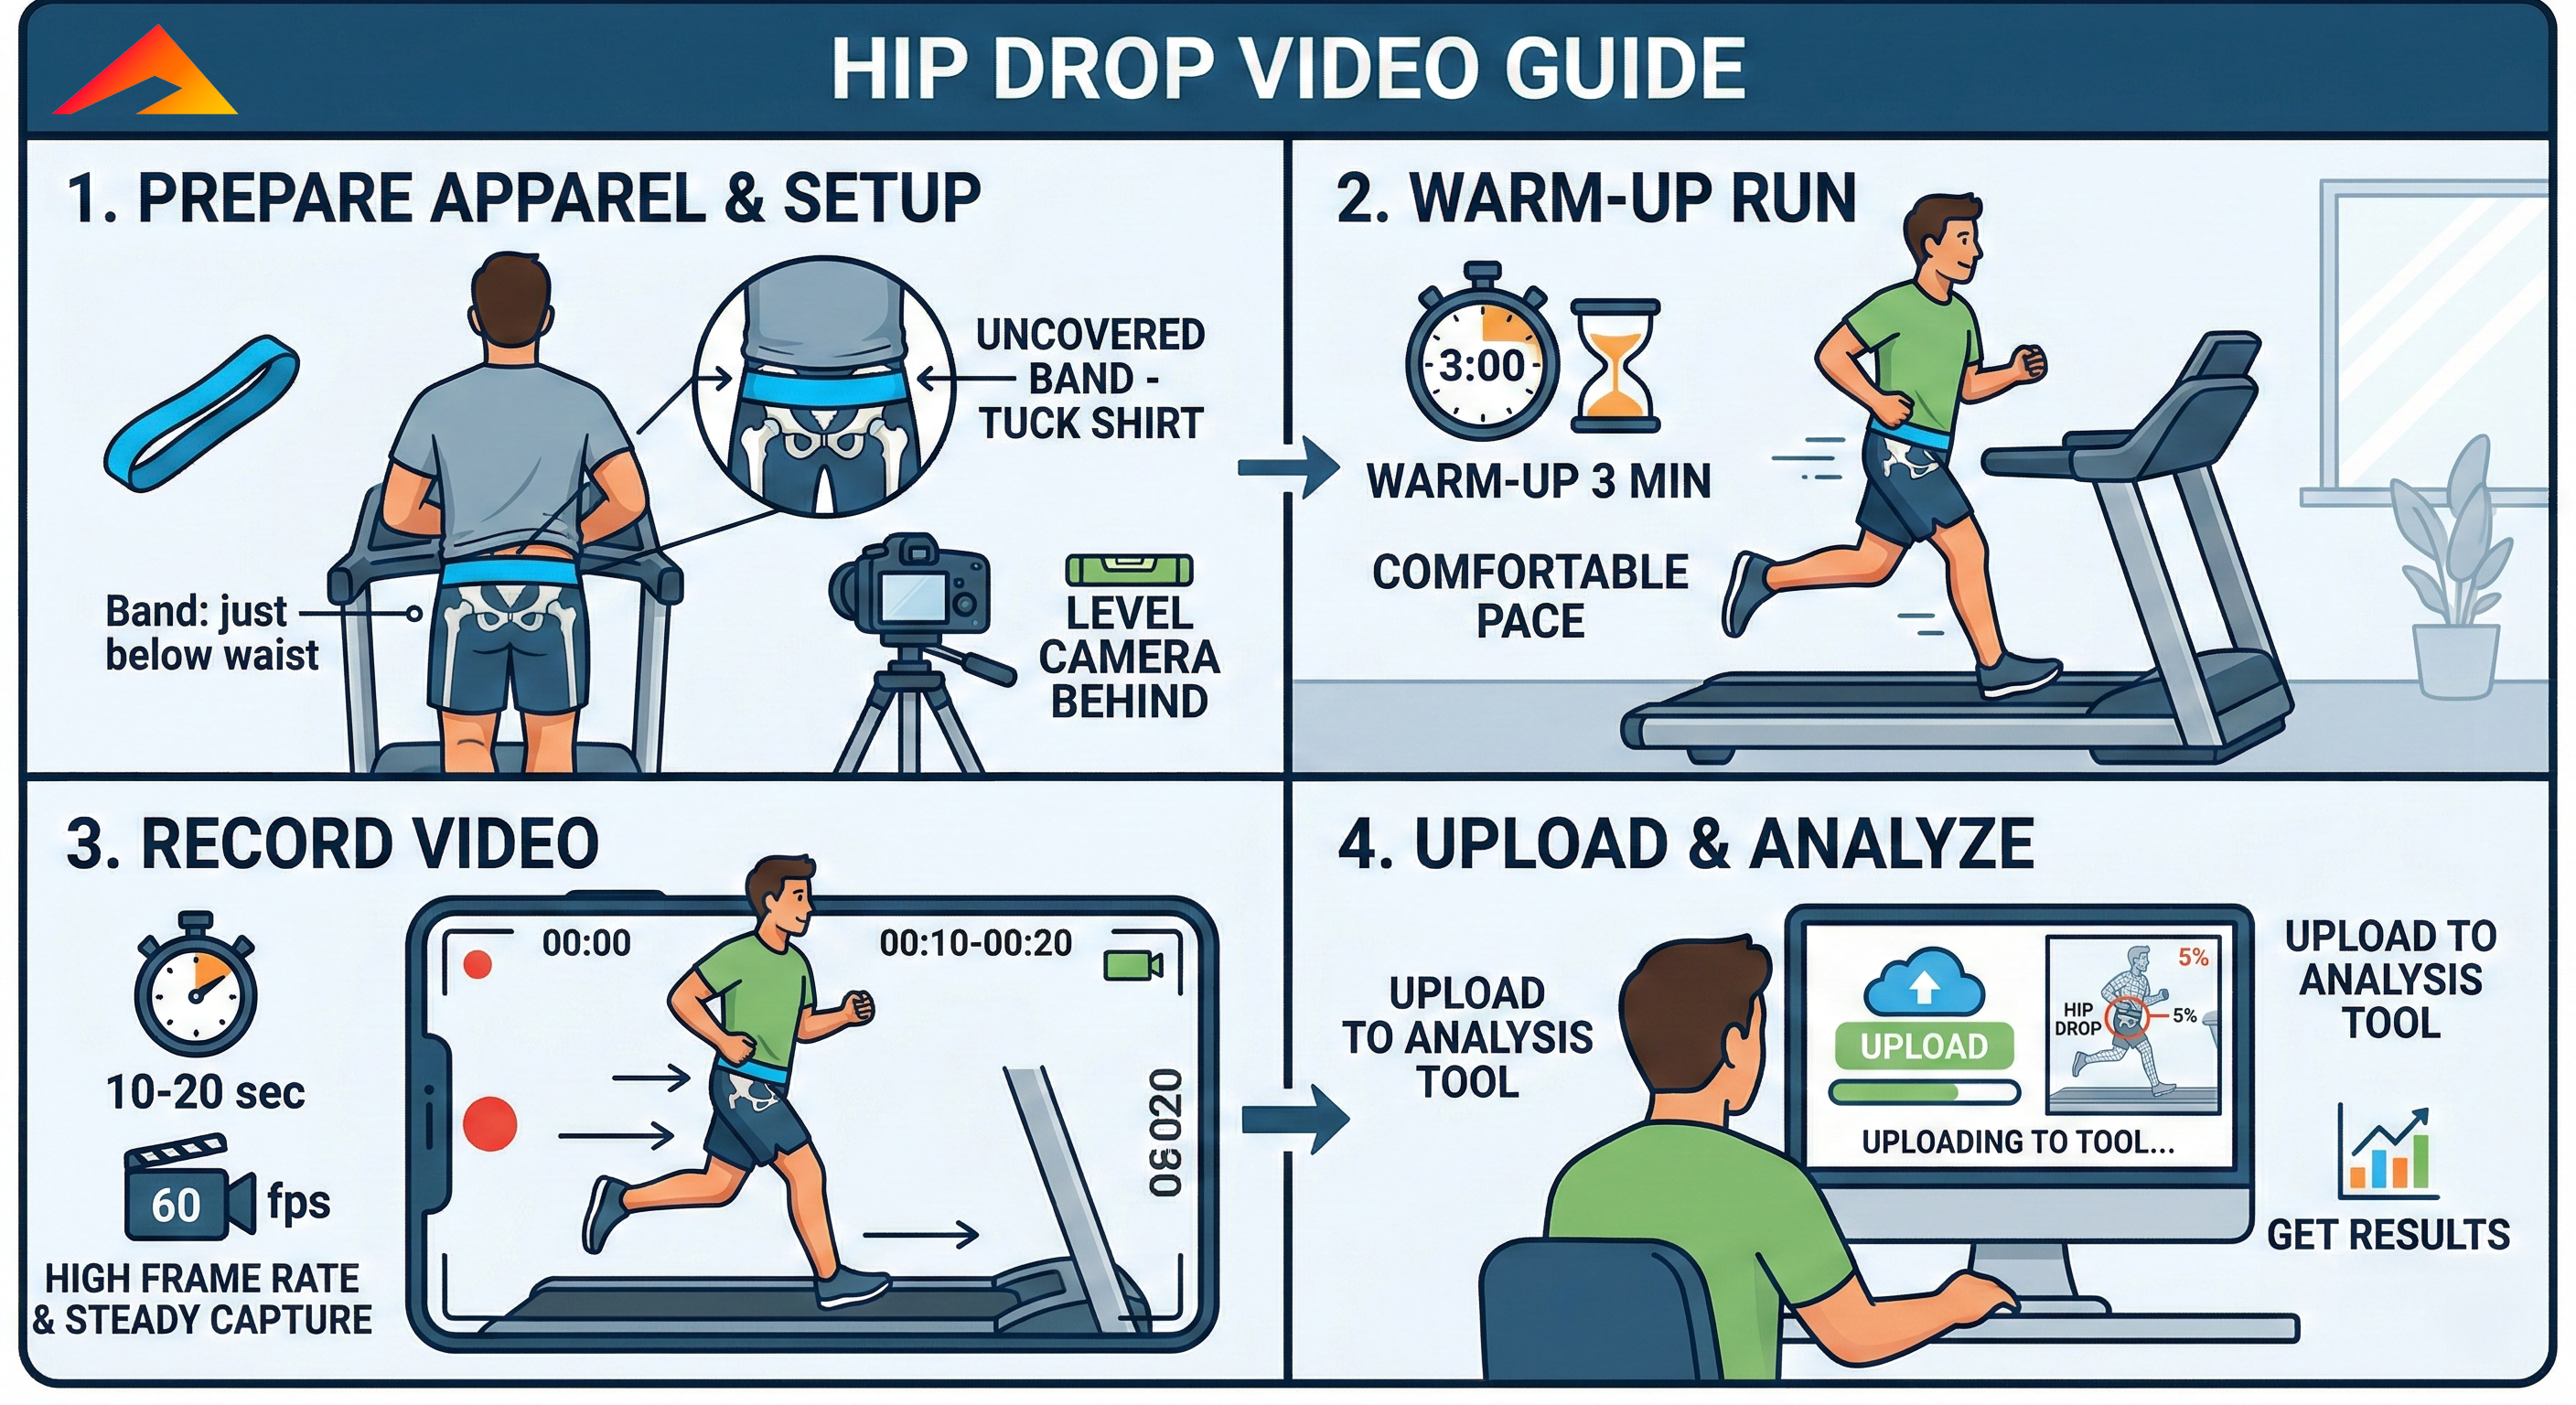
Step 1: Prepare Apparel & Setup
Place a resistance band firmly around your pelvic area, just below your waist. Keep your shirt tucked in and make sure no clothing covers the band so the AI can detect it clearly.
Set your phone or camera on a tripod directly behind the treadmill, level with your hips.
Step 2: Warm-Up Run
Warm up on the treadmill for exactly 3 minutes at your comfortable, normal long-run pace before you begin recording.
Step 3: Record Video
The app samples band tracking at about 10 measurements per second and keeps up to 10 report frames in memory. It samples every second during the first 10 seconds, every 10 seconds through the first minute, then every minute. New frames replace the oldest frames first.
Step 4: Upload & Analyze
Upload the video directly into the browser tool, or choose Live Camera to open the camera immediately. Uploaded clips decode and display their middle frame automatically. Press and hold the band to see a magnified pixel and its color, move to refine the selection, then release to select it.
For live calibration, either capture a camera frame or use the adjacent Upload Calibration Photo or Clip button. The live preview is mirrored for positioning, but the captured image and all measurements remain in the original camera coordinates. Press the band, refine the magnified pixel, release to select it, then confirm and begin analysis.
For uploaded video, use the single yellow selection bar under the replay before analyzing. Drag either large yellow handle inward to remove time from the beginning or end. The selector supports touch, mouse, and keyboard input, and only the yellow timeline segment is processed. Replay speed can be set to 1/4x, 1/2x, or 1x. Use the playback bar, Play/Pause, and previous/next frame buttons for review. Replay is drawn as a synchronized frame-and-overlay image so the OpenCV rectangle stays on the same presented frame.
Auto-level measurements to the median is on by default. It centers an uploaded clip on its overall median. During live analysis, it continuously subtracts the rolling median from the most recent 60 seconds. Because this removes persistent athlete asymmetry as well as camera tilt, turn it off before analysis when you need the absolute camera-relative slope.
When analysis finishes, use Download Report or Share Report to create a PDF with charts, session statistics, coaching cues, and the in-memory representative frames. Each report frame includes the detected band rectangle and semi-transparent one-minute left/right metrics. If device file sharing is unavailable, Share Report downloads the PDF instead.
Uploaded video remains unmirrored. Live video is mirrored only for display; OpenCV calculations and PDF frames stay in the original camera frame. A positive value means the camera-frame right side is lower, and a negative value means the camera-frame left side is lower. OpenCV uses the legacy tilted-rectangle angle convention and outlines the band with a translucent rectangle. A semi-transparent digital level above the band shows the current angle in degrees. The one-minute cards are labeled Left Max and Right Max. Turn on Angle Line to draw a manual line and show its angle; use Erase Line to remove it. The replay and live feed fit within 90% of the screen, and the two long charts are stacked vertically with their shared range slider on the left.